

Industry Trends
Columbia Sportswear Company Reports Fourth Quarter and Record Full Year 2019 Financial Results; Provides 2020 Financial Outlook
Source:China Sport ShowRelease time:24-Feb-2020Clicks:
Article From:WFSGI News Alert
Net sales increased 4 percent compared to fourth quarter 2018, to a record $954.9 million.
Operating income decreased 9 percent to $138.6 million and operating margin declined 210 basis points to 14.5 percent of net sales, compared to fourth quarter 2018 operating income of $152.8 million, or 16.6 percent of net sales. Compared to non-GAAP fourth quarter 2018 operating income of $154.5 million, or 16.8 percent of net sales, operating income decreased 10 percent and operating margin declined 230 basis points.
Diluted earnings per share increased 2 percent to $1.67, compared to fourth quarter 2018 diluted earnings per share of $1.63. Fourth quarter 2019 diluted earnings per share includes $0.09 of discrete tax benefits. Compared to non-GAAP fourth quarter 2018 diluted earnings per share of $1.68, diluted earnings per share decreased 1 percent.
The board of directors approved an 8 percent increase in the company's regular quarterly dividend to $0.26 per share.
Full Year 2019 Highlights
Net sales increased 9 percent (10 percent constant-currency) compared to 2018, to a record $3,042.5 million.
Operating income increased 13 percent to a record $395.0 million and operating margin expanded 50 basis points to 13.0 percent of net sales, compared to 2018 operating income of $351.0 million, or 12.5 percent of net sales. Compared to non-GAAP 2018 operating income of $362.4 million, or 12.9 percent of net sales, operating income increased 9 percent and operating margin expanded 10 basis points.
Diluted earnings per share increased 27 percent to a record $4.83, compared to 2018 diluted earnings per share of $3.81. Compared to non-GAAP 2018 diluted earnings per share of $4.01, diluted earnings per share increased 20 percent.
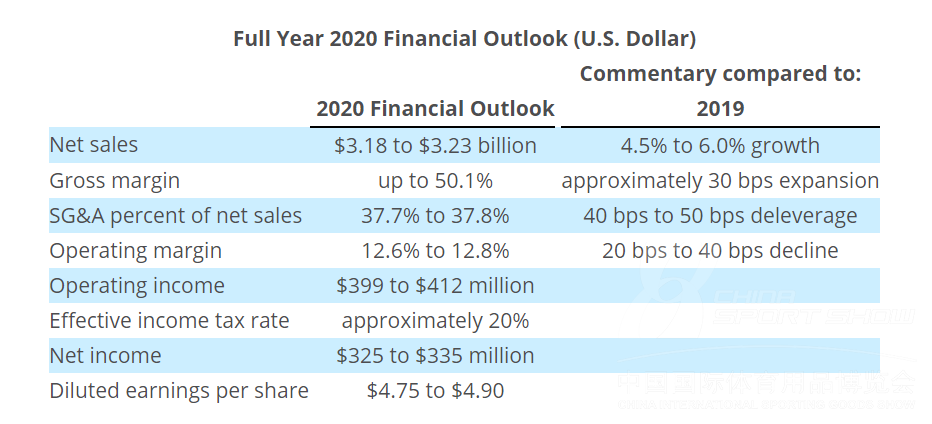
Full Year 2020 Financial Outlook
(Financial outlook details can be found in the Full Year 2020 Financial Outlook section below and the CFO Commentary document.)
For 2020, management currently expects:
Net sales of $3.18 to $3.23 billion, representing net sales growth of 4.5 to 6.0 percent.
Operating income of $399 to $412 million, representing operating margin of 12.6 to 12.8 percent.
Diluted earnings per share of $4.75 to $4.90.
Throughout this press release, amounts stated to be non-GAAP exclude items described in the "Non-GAAP Financial Measures" section below. Additionally, constant-currency net sales, a non-GAAP financial measure, is referenced throughout this press release. Please see the "Supplemental Financial Information" section and financial tables included below for a more detailed description of this and other non-GAAP financial measures.
PORTLAND, Ore.--(BUSINESS WIRE)-- Columbia Sportswear Company (NASDAQ: COLM), a leading innovator in active outdoor apparel, footwear, accessories and equipment, today announced fourth quarter 2019 financial results for the period ended December 31, 2019.
Chairman, President and Chief Executive Officer Tim Boyle commented, “2019 was a record year for Columbia Sportswear Company, with sales surpassing the $3 billion mark for the first time in our company’s history. I’d like to congratulate and thank our employees around the world whose hard work and dedication enable our success. While we celebrate these financial results, 2019 was also a year of remembrance as we lost our 'One Tough Mother' Chairman and matriarch Gert Boyle, whose strength and character guided this company for nearly 50 years. Her mantra ‘It’s Perfect, Now Make it Better’ drives our culture of relentless improvement, and her image and likeness will remain an integral part of our branding.”
“In the fourth quarter, a challenging retail environment, particularly in outerwear, impacted sell-through performance and led to higher levels of promotional activity. In this environment, we delivered results generally in-line with our guidance, including continued exceptional growth for the SOREL brand.”
“As we begin 2020, our unique brand portfolio, diversified business model and fortress balance sheet provide a foundation of strength and confidence from which we will continue investing in our strategic priorities to:
drive brand awareness and sales growth through increased, focused demand creation investments;
enhance consumer experience and digital capabilities in all our channels and geographies;
expand and improve global direct-to-consumer operations with supporting processes and systems; and
invest in our people and optimize our organization across our portfolio of brands."
"We are making these investments to build on our strengths as a brand-led, consumer-focused organization and to enable sustainable long-term profitable growth."
CFO's Commentary Available Online
For a detailed review of the Company's fourth quarter and full year 2019 financial results and full year 2020 financial outlook, please refer to the CFO Commentary exhibit furnished to the Securities and Exchange Commission (the "SEC") on Form 8-K and published on the Investor Relations section of the Company's website at http://investor.columbia.com/results.cfm at approximately 4:15 p.m. ET today. Analysts and investors are encouraged to review this commentary prior to participating in the conference call.
Non-GAAP Financial Measures
Throughout this press release, non-GAAP amounts in fourth quarter 2018 exclude $2.4 million in incremental provisional income tax expense related to the Tax Cuts and Jobs Act (“TCJA”) and $1.7 million in Project CONNECT expenses and discrete costs ($1.3 million net of tax). References to non-GAAP financial measures for full year 2018 exclude $15.8 million in Project CONNECT program expenses and discrete costs ($12.0 million net of tax), $5.1 million in incremental provisional income tax expense related to the TCJA and a $4.3 million benefit in connection with an insurance claim recovery ($3.3 million net of tax). These excluded items were not applicable to fourth quarter and full year 2019 results.
Fourth Quarter 2019 Financial Results
(All comparisons are between fourth quarter 2019 and fourth quarter 2018, unless otherwise noted.)
Net sales increased 4 percent to $954.9 million, from $917.6 million for the comparable period in 2018.
Gross margin declined 160 basis points to 50.1 percent of net sales from 51.7 percent of net sales for the comparable period in 2018.
SG&A expenses increased 6 percent to $344.4 million, or 36.1 percent of net sales, from $326.3 million, or 35.6 percent of net sales, for the comparable period in 2018. SG&A expenses increased 6 percent from non-GAAP SG&A expenses of $324.6 million, or 35.4 percent of net sales, for the comparable period in 2018.
Operating income decreased 9 percent to $138.6 million, or 14.5 percent of net sales, from $152.8 million, or 16.6 percent of net sales, for the comparable period in 2018. Operating income decreased 10 percent from non-GAAP operating income of $154.5 million, or 16.8 percent of net sales, for the comparable period in 2018.
Income tax expense was $26.8 million, resulting in an effective income tax rate of 19.0 percent, compared to income tax expense of $41.0 million, or an effective income tax rate of 26.6 percent, for the comparable period in 2018. Non-GAAP fourth quarter 2018 income tax expense was $39.0 million, which resulted in a non-GAAP effective income tax rate of 25.0 percent.
Net income increased 1 percent to $114.0 million, or $1.67 per diluted share, from $113.3 million, or $1.63 per diluted share, for the comparable period in 2018. Net income decreased 2 percent from non-GAAP net income of $116.9 million, or $1.68 per diluted share for the comparable period in 2018. Fourth quarter 2019 net income includes the benefit of full ownership of our China business, which became a wholly-owned subsidiary effective January 2019. In fourth quarter 2018, the non-controlling interest share of net income was $0.1 million, or less than $0.01 per diluted share.
Full Year 2019 Financial Results
(All comparisons are between full year 2019 and full year 2018, unless otherwise noted).
Net sales increased 9 percent (10 percent constant-currency) to $3,042.5 million, from $2,802.3 million in 2018.
Gross margin expanded 30 basis points to 49.8 percent of net sales, from 49.5 percent of net sales in 2018.
SG&A expenses increased 8 percent to $1,136.2 million, or 37.3 percent of net sales, from $1,051.2 million, or 37.5 percent of net sales, in 2018. SG&A expenses increased 9 percent from non-GAAP SG&A expenses of $1,039.7 million, or 37.1 percent of net sales, in 2018.
Operating income increased 13 percent to $395.0 million, or 13.0 percent of net sales, from operating income of $351.0 million, or 12.5 percent of net sales, in 2018. Operating income increased 9 percent from non-GAAP operating income of $362.4 million, or 12.9 percent of net sales, in 2018.
Income tax expense was $74.9 million, resulting in an effective income tax rate of 18.5 percent, compared to income tax expense of $85.8 million, or an effective income tax rate of 23.8 percent, in 2018. Non-GAAP 2018 income tax expense was $83.4 million, which resulted in a non-GAAP effective income tax rate of 22.4 percent.
Net income increased 23 percent to $330.5 million, or $4.83 per diluted share, from $268.3 million, or $3.81 per diluted share, in 2018. Net income increased 17 percent from non-GAAP net income of $282.0 million, or $4.01 per diluted share in 2018. 2019 diluted earnings per share includes the benefit of full ownership of our China business. In 2018, the non-controlling interest share of net income was $6.7 million, or $0.10 per diluted share.
Balance Sheet as of December 31, 2019
Cash, cash equivalents and short-term investments totaled $687.7 million, compared to $700.6 million at December 31, 2018.
Inventories increased 16 percent to $606.0 million, compared to $521.8 million at December 31, 2018.
Share Repurchases for the Twelve Months Ended December 31, 2019
The Company repurchased 1,243,872 shares of common stock for an aggregate of $121.2 million, or an average price per share of $97.46.
Regular Quarterly Cash Dividend
At its board meeting on February 3, 2020, the board of directors authorized an 8 percent increase to the Company's regular quarterly cash dividend to $0.26 per share, payable on March 23, 2020 to shareholders of record on March 10, 2020.
Full Year 2020 Financial Outlook
The Company’s 2020 Financial Outlook is forward-looking in nature and actual results may differ materially from projections as a result of, among other things, the factors described under “Forward-Looking Statements” below. The projections in the Company’s 2020 Financial Outlook are predicated on certain assumptions including, but not limited to, normal seasonal weather globally and that current macroeconomic, geopolitical and market conditions in key markets do not worsen. Projections do not include the potential financial impact of the coronavirus outbreak, the effect of which is unable to be predicted with any degree of certainty at this time. With respect to the coronavirus outbreak, our first priority has been to take appropriate measures to ensure the health and safety of our employees and customers in this evolving environment. As a result, we have closed stores in China, implemented strategies designed to mitigate the impact on our employees in China and put in place company-wide travel limitations. The potential impacts of the outbreak are broad-reaching including impacts to our DTC and wholesale businesses. We are already experiencing lower store traffic at stores that remain open in China and stores outside of China that benefit from Chinese tourism. In addition, there are potential operational impacts across our supply chain.
Conference Call
The Company will hold its fourth quarter 2019 conference call at 5:00 p.m. ET today. Dial (877) 407-9205 to participate. The call will also be webcast live on the Investor Relations section of the Company's website at http://investor.columbia.com.
First Quarter 2020 Reporting Date
Columbia Sportswear Company plans to report first quarter 2020 financial results on Thursday, April 30, 2020 at approximately 4:00 p.m. ET
Supplemental Financial Information
Since Columbia Sportswear Company is a global company, the comparability of its operating results reported in U.S. dollars is affected by foreign currency exchange rate fluctuations because the underlying currencies in which it transacts change in value over time compared to the U.S. dollar. To supplement financial information reported in accordance with GAAP, the Company discloses constant-currency net sales information, which is a non-GAAP financial measure, to provide a framework to assess how the business performed excluding the effects of changes in the exchange rates used to translate net sales generated in foreign currencies into U.S. dollars. The Company calculates constant-currency net sales by translating net sales in foreign currencies for the current period into U.S. dollars at the average exchange rates that were in effect during the comparable period of the prior year. Management believes that this non-GAAP financial measure reflects an additional and useful way of viewing an aspect of our operations that, when viewed in conjunction with our GAAP results, provides a more comprehensive understanding of our business and operations. In particular, investors may find the non-GAAP measures useful by reviewing our net sales results without the volatility in foreign currency exchange rates. This non-GAAP financial measure also facilitates management's internal comparisons to our historical net sales results and comparisons to competitors' net sales results.
Additionally, this document includes references to various other non-GAAP financial measures related to 2018 that may exclude program expenses, discrete costs and associated tax effects related to Project CONNECT, TCJA-related income tax expense, and a recovery in connection with an insurance claim and related tax effects. The related tax effects of program expenses and discrete costs related to Project CONNECT and the insurance claim recovery benefit were calculated using the respective statutory tax rates for applicable jurisdictions. Management believes that these non-GAAP financial measures enable useful and meaningful comparisons of our operating performance from period to period because they exclude the effects of the aforementioned items above that may not be indicative of our core operating results. These excluded items were not applicable to fourth quarter and full year 2019 results.
These non-GAAP financial measures, including constant-currency net sales, should be viewed in addition to, and not in lieu of or superior to, our financial measures calculated in accordance with GAAP. The Company provides a reconciliation of non-GAAP measures to the most directly comparable financial measure calculated in accordance with GAAP. See the "Reconciliation of GAAP to Non-GAAP Financial Measures" table included herein. The non-GAAP financial measures and constant-currency information presented may not be comparable to similarly titled measures reported by other companies.
Forward-Looking Statements
This document contains forward-looking statements within the meaning of the federal securities laws, including statements regarding our strategic priorities and anticipated results, including anticipated net sales, gross margin, SG&A percent of net sales, operating margin, operating income, effective income tax rate, net income and diluted earnings per share. Forward-looking statements often use words such as "will", "anticipate", "estimate", "expect", "should", "may" and other words and terms of similar meaning or reference future dates. The Company's expectations, beliefs and projections are expressed in good faith and are believed to have a reasonable basis; however, each forward-looking statement involves a number of risks and uncertainties, including those set forth in this document, those described in the Company's Annual Report on Form 10-K and Quarterly Reports on Form 10-Q under the heading "Risk Factors," and those that have been or may be described in other reports filed by the Company, including reports on Form 8-K. Potential risks and uncertainties that may affect our future revenues, earnings and performance and could cause the actual results of operations or financial condition of the Company to differ materially from the anticipated results expressed or implied by forward-looking statements in this document include: loss of key customer accounts; our ability to effectively execute our business strategies, including initiatives to upgrade our business processes and information technology (“IT”) systems and investments in our DTC businesses; our ability to maintain the strength and security of our IT systems; the effects of unseasonable weather, including global climate change; the seasonality of our business and timing of orders; trends affecting consumer spending, including changes in the level of consumer spending, and retail traffic patterns; unfavorable economic conditions generally, the financial health of our customers and retailer consolidation; higher than expected rates of order cancellations; changes affecting consumer demand and preferences and fashion trends; changes in international, federal or state tax, labor and other laws and regulations that affect our business, including changes in corporate tax rates, unanticipated impacts resulting from additional guidance about and/or the application of the TCJA, tariffs, international trade policy and geopolitical tensions, or increasing wage rates; our ability to attract and retain key personnel; risks inherent in doing business in foreign markets, including fluctuations in currency exchange rates, global credit market conditions, changes in global regulation and economic and political conditions and disease outbreaks; volatility in global production and transportation costs and capacity; our ability to effectively manage our inventory; our dependence on third-party manufacturers and suppliers and our ability to source at competitive prices from them or at all; the effectiveness of our sales and marketing efforts; business disruptions and acts of terrorism, cyber-attacks or military activities around the globe; intense competition in the industry; our ability to establish and protect our intellectual property; and our ability to develop innovative products. The Company cautions that forward-looking statements are inherently less reliable than historical information. The Company does not undertake any duty to update any of the forward-looking statements after the date of this document to conform them to actual results or to reflect changes in events, circumstances or its expectations. New factors emerge from time to time and it is not possible for the Company to predict or assess the effects of all such factors or the extent to which any factor, or combination of factors, may cause results to differ materially from those contained in any forward-looking statement.
About Columbia Sportswear Company
Columbia Sportswear Company has assembled a portfolio of brands for active lives, making it a leader in the global active lifestyle apparel, footwear, accessories, and equipment industry. Founded in 1938 in Portland, Oregon, the Company's brands are today sold in approximately 90 countries. In addition to the Columbia® brand, Columbia Sportswear Company also owns the Mountain Hardwear®, SOREL® and prAna® brands. To learn more, please visit the Company's websites at www.columbia.com, www.mountainhardwear.com, www.sorel.com, and www.prana.com.

Subscribe free Newsletter
- to get up-to-date info of China Sport Show 2024
Contact us
- China Sporting Goods Federation
- China Sport Show Organizing Committee
- Add: Tower A, Building No. 17, Fahuananli, Tiyuguan Road, Dongcheng District, Beiing, China
- E-mail: info@sportshow.com.cn
- Tel: +86-10-87108881
- Fax: +86-10-87183075
©2008-2023 CHINA SPORT SHOW, All Rights Reserved(京ICP备05083596号-2)